ManpowerGroup Employment Outlook Survey

For employers and employees to get the forward-looking perspective on hiring in your area.

ManpowerGroup surveyed a total of 1,020 employers across all states and territories in Australia to measure employer hiring intentions for the third quarter of 2023. All survey participants were asked: “How do you anticipate total employment at your location to change in the three months to the end of September 2023 as compared to the current quarter?” 

MEOS-AU-website_button-download


Australia's Employment Outlook For July - September 2023

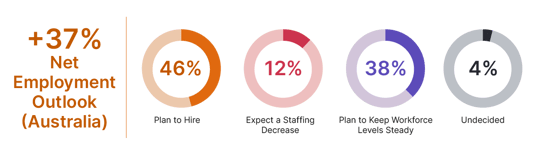
Employers in Australia continue to anticipate hiring more workers in the third quarter of 2023, reporting a seasonally adjusted, Net Employment Outlook of +37%. Hiring intentions increased 7 percentage points quarter-over-quarter but soften by 1 percentage point when compared to this time last year.

MEOS-AU-website_NEO


Optimistic Hiring Market Expected

Looking at Stats

MEOS-AU-website_Regional NEO
For All Regions

Hiring intentions are expected to remain positive across all regions of Australia. Employers in South Australia (+49%), Northern Territory (+47%) and Tasmania (+45%) report the strongest hiring sentiments. Meanwhile, the weakest hiring climate is expected in Queensland (+27%), weakening by 8 and 6 percentage points quarter-on-quarter and year-on-year respectively.

For All Industry Sectors

Australia’s Information Technology sector recorded the strongest hiring intention in the world: Australian Information Technology sector recorded a Net Employment Outlook of +61%, increasing by 5 percentage points since last quarter and 9 percentage points since a year ago.


For All Organisation Sizes

Micro organisations record the largest increase in hiring intention: Micro organisations (less than 10 employers) recorded a Net Employment Outlook of +38%, an increase of 14 percentage points since last quarter and 12 percentage points since a year ago.


Access the Insights


MEOS-AU-website_button-press release

MEOS-AU-website_button-infographic


Top