Here's a look of Australia's hiring plans for the upcoming months.
The ManpowerGroup Employment Outlook Survey provides employers and employees with a forward-looking perspective on hiring in your area. The survey for the second quarter of 2021 was conducted by interviewing a representative sample of 1,300 employers in Australia.
All survey participants were asked, “How do you anticipate total employment at your location to change in the three months to the end of June 2021 as compared to the current quarter?” Additional questions were asked this quarter to reflect the current environment. These included the likeliness of companies pursuing a policy regarding compulsory employee Covid vaccinations, and how employers foresee the majority of their workforce working in the next 6-12 months. Results are outlined in the Q2 infographic.
EMPLOYERS REPORT STRONGEST HIRING OUTLOOK IN MORE THAN NINE YEARS
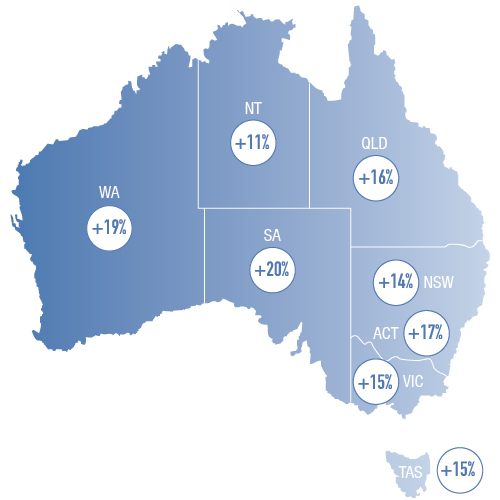
Hiring managers in Australia reported a seasonally adjusted Net Employment Outlook of +17% for the April to June period.
Richard Fischer, Managing Director of ManpowerGroup Australia says “Seeing the most positive Outlook nationally since the second half of 2011 is a strong indication of confidence levels in the market”.
Job gains are again expected in all eight Australian regions. The strongest labor market is anticipated for South Australia (+20%), which is the strongest Net Employment Outlook for the state in a decade.


JOB GAINS FORECAST AGAIN FOR ALL INDUSTRY SECTORS
Results show all seven industries are expected to grow payrolls from April to June.
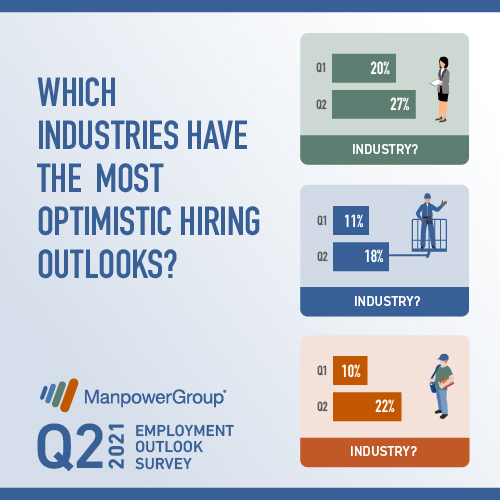
The strongest levels are again forecast for Finance, Insurance & Real Estate, increasing to +27%, which is the strongest reported outlook in more than nine years.
The most cautious sector is Wholesale & Retail Trade with an Outlook of +8%. The sector remains relatively stable quarter-over-quarter and improving by 3 percentage points when compared with this time one year ago.


